
Your employee just had surgery. The procedure was pre-authorized. The surgeon was in-network. The hospital was in-network. And six weeks later, the claim was denied.
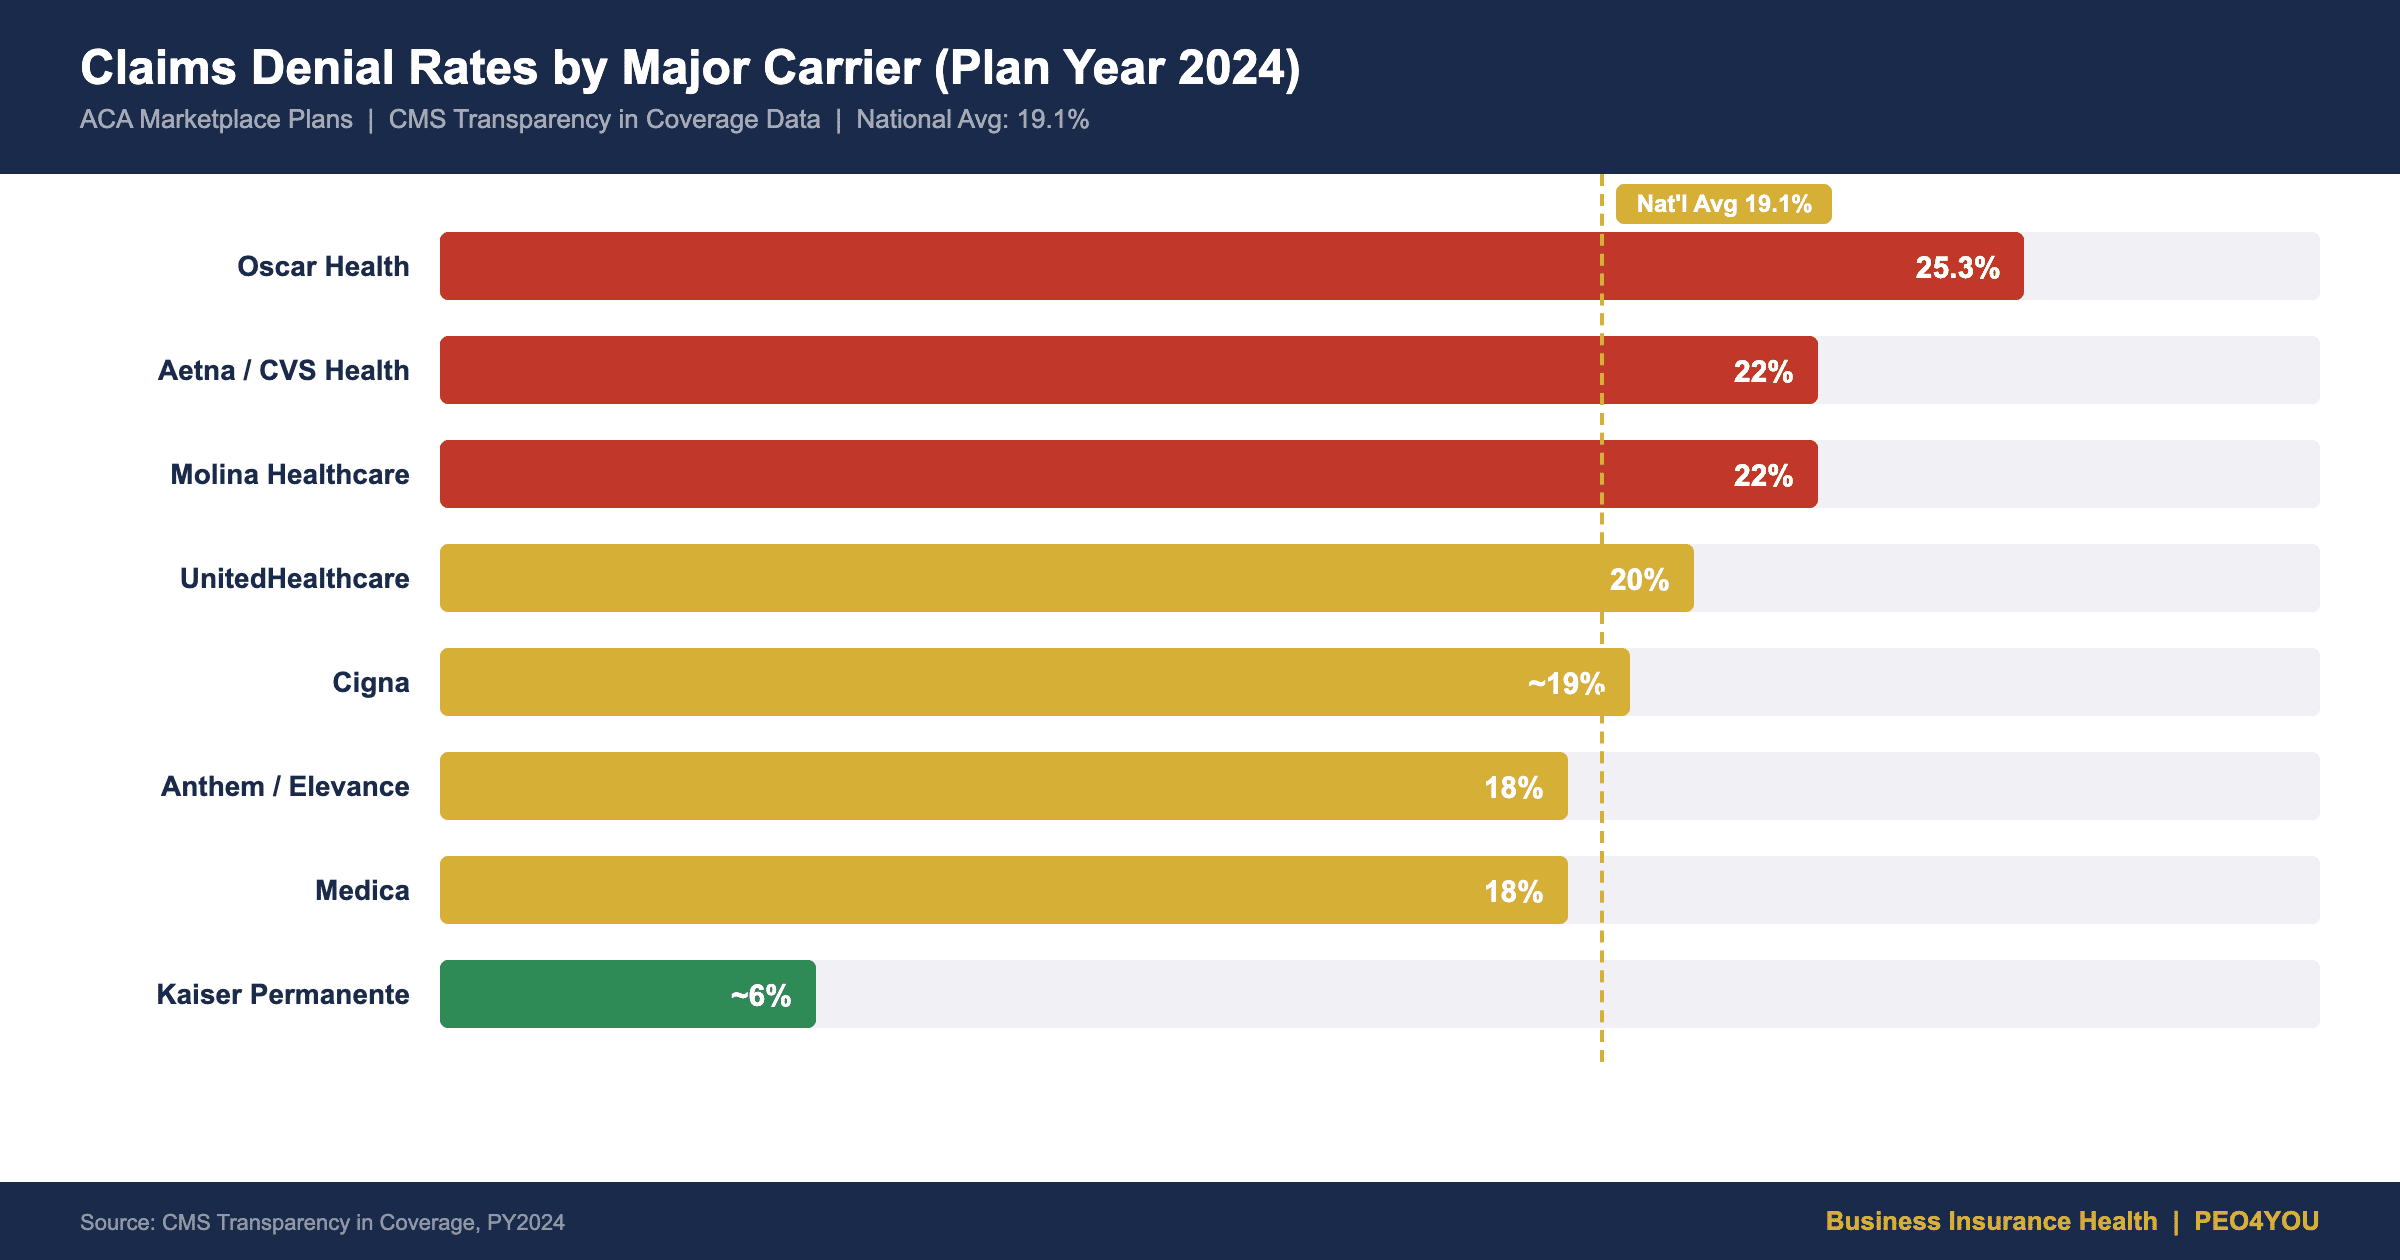
This is not an edge case. According to CMS Transparency in Coverage data, major carriers deny between 18% and 25% of claims on ACA marketplace plans.1 Employer-sponsored plans see similar patterns, though they are not required to report denial rates uniformly. And when a claim is denied, your employee — not your broker, not your HR team, not you — is left spending an estimated 8 to 20 hours on the phone trying to resolve it.
At Business Insurance Health, we call this The Claims Advocacy Gap: the space between what your health plan promises and what your employees actually experience when they need to use it. Closing that gap is one of the most undervalued benefits strategies an employer can implement.
Key Takeaways
- Claims denial rates among major carriers range from 18% to 25% — meaning roughly one in five to one in four claims is initially denied.1
- Employees spend an estimated 8 to 20 hours per disputed claim navigating phone trees, filing appeals, and gathering documentation — time that comes directly out of productivity.
- Many denied claims are reversed on appeal — approximately 40-44% of internal appeals are overturned per KFF data — but fewer than 1% of denied claims are ever appealed because employees do not know how or give up.2
- PEO-based claims advocacy provides a dedicated benefits specialist who intervenes directly with the carrier on the employee’s behalf, resolving disputes in days rather than weeks.
- Claims advocacy is a retention tool: employees who experience successful claims resolution become the strongest advocates for staying with their current employer.
The Claims Advocacy Gap: What the Data Shows
CMS requires carriers to report denial rates through Transparency in Coverage filings. The data paints a clear picture:145
| Carrier | Denial Rate (ACA Marketplace) | Year-Over-Year Trend |
|---|---|---|
| UnitedHealthcare | 20% (down from 33%) | Improving |
| Oscar Health | 25.3% | Worsening |
| Anthem / Elevance | 18% (down from 23%) | Improving |
| Medica | 18% (down from 23%) | Improving |
| Aetna / CVS Health | 22% | Stable |
| Cigna / The Cigna Group | ~20% | Stable |
| Molina Healthcare | 22% | Stable |
| Kaiser Permanente | ~6% (lowest) | Stable |
Source: CMS Transparency in Coverage data, Plan Year 2024 (latest available). ACA marketplace rates shown; employer-sponsored plan denial rates follow similar patterns but are not uniformly reported. The national average denial rate fell from 22.5% (PY2023) to 19.1% (PY2024), with several carriers showing significant improvement. UnitedHealthcare’s improvement from 33% to 20% reflects methodology changes and increased scrutiny.1
The pattern is clear: most major carriers deny roughly one in five claims. For a company with 50 employees, each averaging 10 to 15 claims per year, that means 100 to 150 denied claims annually. Even if only 10% of those require significant employee time to resolve, that is 10 to 15 disputed claims, each requiring an estimated 8 to 20 hours to resolve — 80 to 300 hours of lost productivity per year.
Why Less Than 1% of Denied Claims Are Appealed
Here is the part that should concern every employer: according to KFF analysis, fewer than 1% of denied claims on ACA marketplace plans are appealed by the patient — with PY2021 data showing the rate as low as 0.2% (1 in 500).2 The vast majority of denied claims are simply accepted — even when the denial may be incorrect.
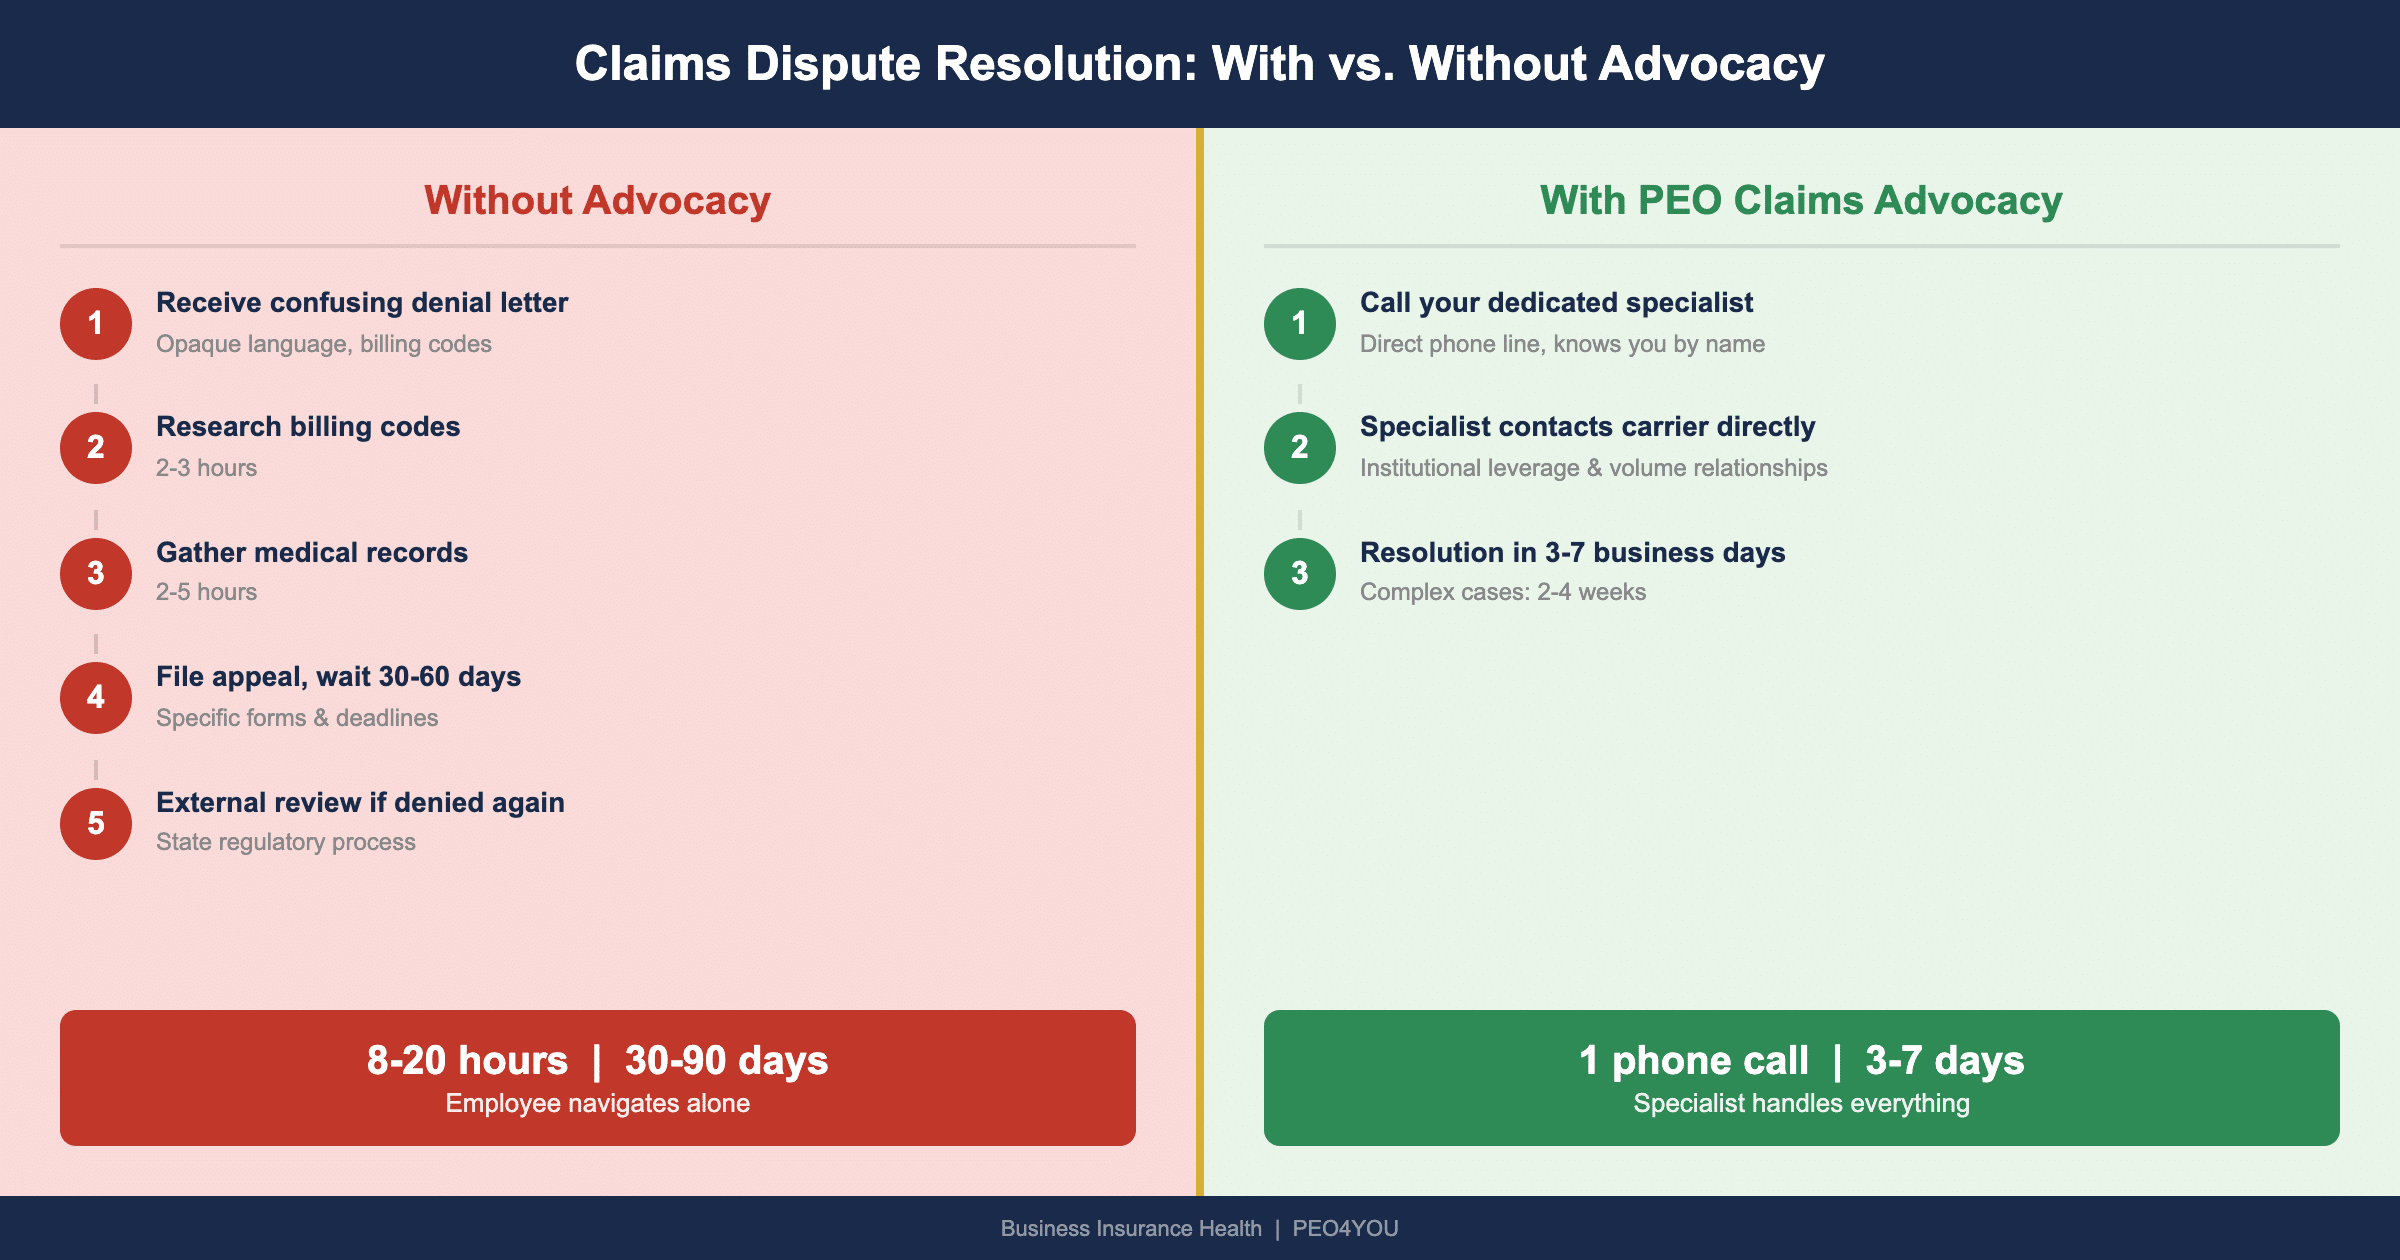
Why? Because the appeals process is designed to exhaust the patient:
- Understanding the denial letter — written in opaque language citing policy sections and billing codes
- Gathering documentation — medical records, pre-authorization confirmations, provider notes
- Filing the internal appeal — specific forms, deadlines, and documentation requirements that vary by carrier
- Waiting for a response — carriers have 30 to 60 days to respond to internal appeals
- Filing an external appeal if the internal appeal is denied — involving a state regulatory process
An employee working full-time while managing a medical condition does not have the bandwidth for this process. They pay the bill, absorb the cost, and quietly resent their employer for providing coverage that does not work when they need it.
What Claims Advocacy Actually Looks Like
In a PEO arrangement through PEO4YOU, every employee has a dedicated benefits specialist — not a call center, not a chatbot, a specific person they can reach by direct phone line and email. When a claim is denied:
- The employee contacts their benefits specialist (or the specialist proactively identifies the denial through claims monitoring)
- The specialist reviews the denial reason — coding error, pre-authorization issue, out-of-network dispute, medical necessity question
- The specialist contacts the carrier directly on the employee’s behalf, using the PEO’s institutional relationship and volume leverage
- Resolution typically occurs within 3 to 7 business days for straightforward denials, 2 to 4 weeks for complex cases
The employee’s involvement: one phone call or email to their benefits specialist. The specialist handles everything else. Compare that to an estimated 8 to 20 hours of the employee navigating the process alone.
“One of our clients had 90-plus claims disputes resolved through advocacy over 6 years. More than $500,000 in claims handled. Zero denials that stuck. That is what institutional advocacy does — it changes the math entirely.”
— Sam Newland, on the difference between individual and institutional claims dispute resolution
The Business Case: Claims Advocacy as a Retention Strategy
The retention value of claims advocacy is asymmetric — the cost to provide it is modest (it is included in PEO administration), but the impact on employee loyalty is outsized.
Consider: an employee who experiences a $15,000 surgery claim denied, then resolved in five days by their benefits specialist, becomes your strongest retention asset. That employee is not leaving for a 5% salary increase at a company where they would have to fight their own claims battles.
With employer health care costs projected to exceed $17,000 per employee in 2026,3 the cost of replacing an employee who leaves due to benefits frustration — typically 50% to 200% of annual salary — far exceeds the cost of providing advocacy.
For more on how plan design affects retention, see high deductible health plan alternatives and what happens when companies switch from ADP to a PEO at PEO4YOU.
📊 PROJECT YOUR HEALTH FUNDING COSTS
See how claims costs and funding strategy affect your bottom line over time. Use the Health Funding Projector below to model scenarios — no login required, no email gate, free.
What to Ask Your Current Broker About Claims Support
Before your next renewal meeting, ask these five questions:
- "What is our plan’s claims denial rate for the last 12 months?" If they cannot answer, that is a problem.
- “When a claim is denied, what specific support do you provide to the employee?” “Call the number on your card” is not support.
- “How many claims disputes did you resolve on behalf of our employees last year?” If the answer is zero, your employees are fighting alone.
- “Can you provide a dedicated contact — by name — for claims issues?” A person, not a department.
- “What is the average resolution time for disputed claims under our plan?” Anything over 30 days is too long.
If the answers are unsatisfying, your employees already know. They are just not telling you.
Frequently Asked Questions
Why are claims denial rates so high across all major carriers?
Denial rates reflect a combination of factors: coding errors, missing pre-authorizations, medical necessity disputes, and administrative processing issues. Some denials are legitimate (services not covered under the plan). But a significant percentage — approximately 40-44% of internal appeals are overturned per KFF data, with even higher reversal rates (60%+) at external independent medical review — suggesting many initial denials were incorrect or premature.2
Does claims advocacy come at an additional cost through a PEO?
No. Claims advocacy is typically included in the PEO’s administration fee. The dedicated benefits specialist who handles claims disputes is the same specialist who handles enrollment, plan questions, and other benefits administration. There is no separate charge for claims intervention.
Can a broker provide the same level of claims advocacy?
Some brokers offer claims assistance, but the structural difference matters. A PEO benefits specialist works for the PEO that administers the plan and has a direct contractual relationship with the carrier. A broker intermediates between the employer and the carrier but typically does not have the same level of operational access to claims systems and carrier contacts.
How do I know if my employees are experiencing claims denials?
Ask. Most employees do not report claims issues to HR because they assume the company cannot help. An anonymous survey asking “Have you experienced a claims denial in the last 12 months?” and “How long did it take to resolve?” will reveal the scope of the problem. The answers may surprise you.
Do claims denial rates differ between employer-sponsored plans and ACA marketplace plans?
CMS reporting is most comprehensive for ACA marketplace plans. Employer-sponsored plans are not required to report denial rates uniformly. However, industry analyses suggest similar patterns: the same carriers using the same claims processing systems produce similar denial rates across plan types. The key variable is not the plan type but the carrier and the claims review process.
📊 CHECK YOUR PLAN QUALITY
Plan Quality & HRA Analyzer at businessinsurance.health
Benchmark your plan design — including carrier selection and network quality — against institutional data.
No login required. No email gate. Free.
References
- Muni Health / CMS Transparency in Coverage Data. “Which Insurance Company Denies the Most Claims? Denial Rates by Insurer 2026.” March 2026. muni.health. Plan Year 2024 data: Oscar 25.3%, Anthem 23%, Aetna 22%, UHC 20%, Kaiser ~6%.
- Kaiser Family Foundation. “Claims Denials and Appeals in ACA Marketplace Plans.” Published January 2025 (analyzing PY2021 and PY2023 data). kff.org. PY2021: 0.2% of denied claims appealed; PY2023: fewer than 1% appealed. Approximately 40-44% of internal appeals overturned; 60%+ at external independent medical review.
- Aon plc. “U.S. Employer Health Care Costs Expected to Rise 9.5 Percent in 2026.” September 2025. aon.mediaroom.com. Projected costs exceeding $17,000 per employee.
- TechTarget / RevCycleManagement. “Breaking Down Claim Denial Rates by Healthcare Payer.” 2025. techtarget.com.
- Fellow Health Partners. “The Hidden Crisis of Insurance Denial Rates.” February 2025. fellowhealthpartners.com. UHC historical rate of 33%.
- National Association of Professional Employer Organizations (NAPEO). “PEO Industry Research & Data.” 2025. napeo.org.
This analysis is for educational purposes and does not constitute financial or legal advice. Claims denial rates are based on publicly available CMS data and may vary by plan type and geography.
About the Author
Sam Newland, CFP® is the Founder and President of Business Insurance Health and PEO4YOU. Contact: [email protected] | 857-255-9394