
This scenario plays out at thousands of businesses every single day. Employers pay premiums that climb 5–8% annually, yet employees skip preventive care, avoid doctor visits for manageable conditions, and end up in emergency rooms for preventable crises. The result: wasted benefit dollars, reduced productivity, and a growing sense that the health insurance benefit isn't worth the stress it creates.
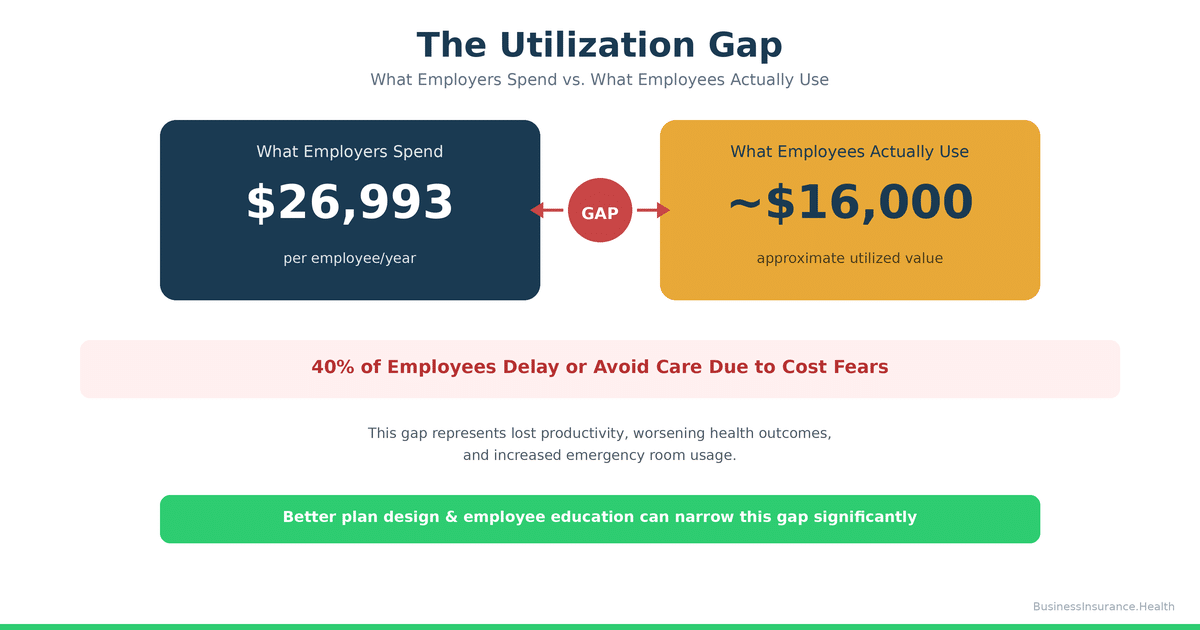
We call this The Utilization Gap—the measurable difference between what employers spend on benefits and what employees actually consume. It's the silent drain on your health plan ROI, and it costs more than you think.
The Real Cost of Underutilization: Why Skipped Preventive Care Becomes Your Most Expensive Claim
The business case for preventive care is straightforward: screening catches disease early, when treatment is cheaper and outcomes are better. A colonoscopy costs $1,500. Colorectal cancer treatment costs $150,000+. A cholesterol screening costs $50. A heart attack costs $350,000+.
Yet across the U.S., employees consistently skip preventive visits covered at 100% under their health plans. Research suggests a significant portion of eligible employees—potentially more than 40%—never schedule routine physicals or preventive screenings, even when there is zero out-of-pocket cost1.
When preventive care is skipped, three costly outcomes follow:
1. Presenteeism: The Hidden Productivity Drain of Working While Sick
The Integrated Benefits Institute estimates that presenteeism—employees coming to work while ill, injured, or managing undiagnosed chronic conditions—costs employers approximately $227 billion annually in lost productivity across the U.S. workforce2. In practical terms, a single employee working with untreated hypertension, diabetes, or depression reduces team productivity by 20–30% while the condition goes unmanaged.
Why does this happen? Employees avoid scheduling doctor appointments because they don't understand their plan's deductible, fear surprise bills, or worry that a visit will trigger elevated insurance costs or employer notification. The result: they show up to work sick, less productive, and increasingly at risk of developing serious complications.
2. Emergency Room Overuse Instead of Primary Care
When employees avoid primary care, they migrate toward emergency departments. The Journal of Primary Care & Community Health reports that 59% of emergency room visits are for conditions that could have been managed in a primary care setting3. For an employer, this is devastating economics: an ER visit costs $1,200–$3,000 for a condition that a $200 primary care appointment could have prevented.
Consider a 75-employee electrical contractor with a self-funded plan. When employees don't understand how to access their in-network PCP or fear the cost of a deductible, minor infections become ER visits, minor chest pain becomes a $5,000 cardiac workup, and preventable flare-ups become overnight hospitalizations. Over 12 months, this single breakdown in plan communication can cost the employer an extra $40,000–$80,000 in avoidable claims.
3. Late-Stage Diagnoses That Explode Your Claims Costs
When employees delay seeking care, diseases progress further before treatment. A diabetes diagnosis caught at A1c 6.8 requires medication and lifestyle change; caught at A1c 9.2, it requires aggressive pharmacotherapy and sets the stage for neuropathy, kidney disease, and cardiovascular complications. The long-term claims cost of late-stage diagnosis is 3–5 times higher than early intervention4.
This is the core inefficiency of the Utilization Gap: employers pay for insurance designed to catch disease early, but plan design and communication failures sabotage that entire purpose.
Four Plan Design Failures That Drive Employees to Avoid Their Health Insurance
Design Failure #1: Deductible Shock – The $6,800 Barrier to Care
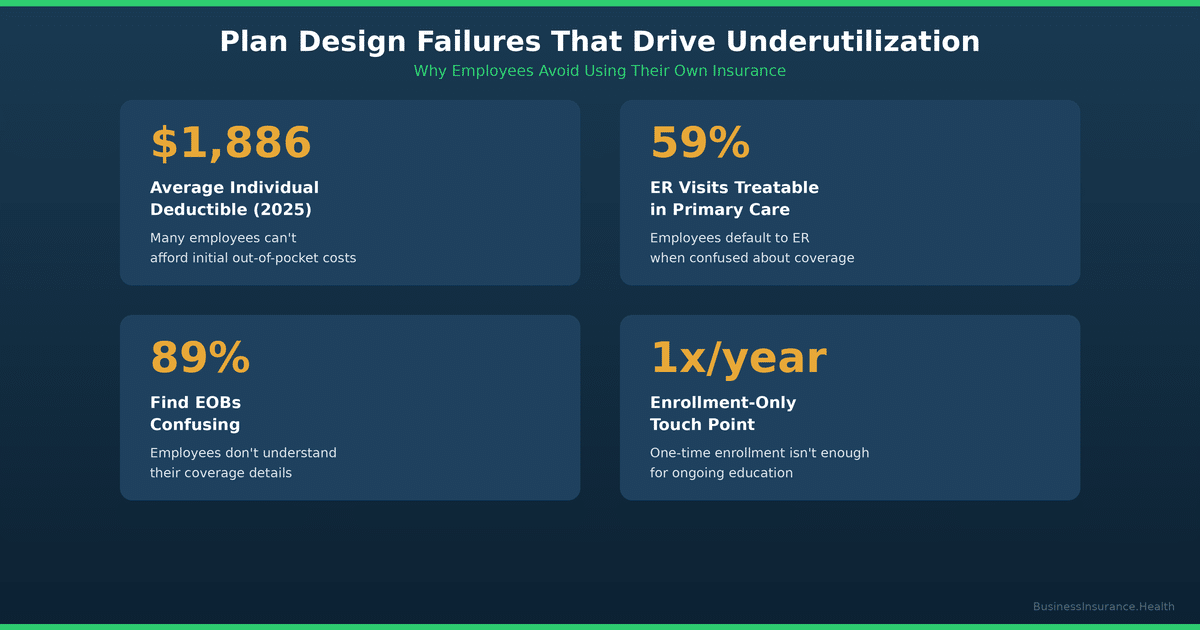
The average individual health insurance deductible in 2025 is $1,886; for high-deductible plans, it climbs to $2,500–$6,8005. What seems reasonable at enrollment feels catastrophic the moment an employee gets injured or diagnosed with something requiring ongoing treatment.
The psychological impact is severe: an employee with a $3,500 family deductible perceives the first $3,500 of care as "full price." Even if their insurance covers 80% after the deductible, the mental math is: "I'm spending $3,500 out of pocket before my insurance even kicks in." This perception, regardless of its accuracy, drives avoidance.
We observe this consistently in self-funded plans where the employer directly bears the claims risk. A mid-size construction firm with a $250,000 revenue-per-employee model can afford a $5,000 deductible from a pure financial standpoint—but their employees cannot. The result: employees delay or forgo care, push small health issues to the edge of crisis, and then generate much larger claims when they finally seek emergency treatment.
The fix: Pair high-deductible plans with Health Reimbursement Accounts (HRAs) or Health Savings Account (HSA) contributions funded by the employer. When employees begin the year with $2,000–$3,000 in employer-funded HSA contributions, the psychological barrier to using their plan drops dramatically, and utilization increases significantly6.
Design Failure #2: Network Confusion – Employees Don't Know Who's In-Network
Surveys indicate that many employees—potentially more than half—report difficulty navigating in-network provider directories or are unsure whether their chosen provider is in-network7. This creates a dual problem:
First, employees choose out-of-network providers due to perceived familiarity or convenience, triggering higher out-of-pocket costs and surprise bills. Research suggests a meaningful portion of remote workers and younger employees use out-of-network providers specifically because they lack confidence in the network directory or don't trust that the network is "real"8.
Second, employees avoid care entirely to avoid the risk of network confusion. If you're unsure whether your dermatologist is in-network and you're afraid of a $500 surprise bill, the rational choice becomes "don't get the skin condition treated."
The fix: Audit your TPA's provider network directory for completeness and accuracy. Remove outdated or inactive provider listings. Implement a mobile-first provider search tool that employees can use directly from their phone at the point of care. Better: partner with a PEO or managed benefits platform that takes network accountability as a core service responsibility, with real-time verification and employee protections against surprise bills.
Design Failure #3: Communication Failure – TPAs Send Confusing EOBs, Letters, and Policy Updates
Third-party administrators (TPAs) are essential for plan administration, but many operate with communication templates designed for compliance, not clarity. Employees receive Explanation of Benefits (EOBs) filled with medical codes, plan language, and deductible tracking that make even educated readers confused about what they actually paid, what they owe, and what happens next.
One of our recent client conversations: a 50-person firm's TPA sent an EOB that listed a $300 charge, applied $200 to the employee's deductible, and stated the employee's "responsibility" as $0. The employee called HR four times convinced they owed $100 and were going to be pursued by collections. The actual interpretation was: "Your deductible is now $100 lower, and you owe nothing today." The communication failure created stress and eroded confidence in the plan.
Similarly, when a plan transitions to new leadership, new carriers, or new TPAs, the communication vacuum fills with rumor and fear. We observed this at a regional electrical contractor where plan changes under new ownership triggered rumors of "network cuts" that had no basis in fact—but the perception alone was enough to drive employee avoidance of routine care out of fear that their doctor might be cut from the network.
The fix: Invest in employee benefits communication as a core HR function. Host annual plan reviews, one-on-one benefits education sessions, and clear written guides explaining deductibles, out-of-pocket costs, and step-by-step examples of what happens when an employee visits the doctor. When plan changes occur, communicate proactively and repeatedly. Assign a dedicated HR team member or external benefits advisor to be the "translator" between TPA jargon and employee reality. The cost of this communication ($2,000–$5,000 annually) is repaid tenfold through increased utilization and reduced claims volatility.
Design Failure #4: No Benefits Onboarding or Education – Employees Never Learn How to Use Their Plan
Many employers treat health insurance enrollment as a one-time event: new hires choose a plan option, sign paperwork, and are handed a benefits guide they never read. There is no follow-up education about how to access care, what's covered, how to file a claim, or what to do if a bill seems wrong.
The result is a workforce that is technically "insured" but functionally illiterate about their own coverage. When a health need arises, they make decisions based on assumptions, word-of-mouth, or fear rather than facts.
The fix: Build an employee benefits education program into your annual HR calendar. Host a 30-minute group overview during new hire orientation. Provide written, video, and interactive resources showing exactly how to use the plan. Incentivize preventive care completion through modest wellness bonuses or premium reductions for those who complete an annual physical. For smaller employers, consider partnering with a PEO or benefits broker who can handle this education on your behalf.
How to Measure Your Utilization Gap: A Simple 4-Step Audit
The first step to closing the Utilization Gap is measuring it. Here's how to assess whether your employees are actually using their health insurance:
Step 1: Request Utilization Data from Your TPA or Broker
Ask for a claims utilization report showing: (a) preventive visit completion rates, (b) average visits per employee per year, (c) emergency department visits as a percentage of total claims, and (d) filled prescription rates for chronic disease management medications (diabetes, hypertension, depression). Benchmark these against industry averages for your company size and claims history.
Step 2: Calculate Your ER-to-PCP Ratio
Divide your total emergency department claims by your total primary care visit claims. A healthy ratio is 1 ER visit per 8–10 primary care visits. If your ratio is 1:4 or worse, employees are avoiding primary care and migrating toward the ER.
Step 3: Survey Your Employees
Ask anonymously: "In the past 12 months, have you avoided or delayed seeking healthcare due to cost concerns?" and "Do you understand your plan's deductible and out-of-pocket maximum?" Responses will reveal gaps between plan design intent and employee perception.
Step 4: Calculate the Cost of Underutilization
Research consistently shows that increased preventive care utilization correlates with lower overall claims costs, as early intervention prevents costly acute episodes. If your current claims trend is +6% year-over-year, a utilization improvement could flatten or reverse that trend entirely. The financial opportunity is substantial.
Solutions: Three High-ROI Approaches to Close the Utilization Gap
Solution 1: Redesign Your Plan With HSA/HRA Funding
Replace or complement a high-deductible plan with employer-funded HSA or HRA contributions. Rather than asking employees to shoulder a $3,000 deductible out of pocket, provide them with $2,500 in employer-funded HRA credits each year.
The impact is measurable: studies suggest employer-funded HSA or HRA contributions can increase preventive care utilization by roughly 20–30%, reduce emergency department visit rates by approximately 15–20%, and improve chronic disease medication adherence compared to employees with the same plan structure but no employer funding9.
Additionally, HRA structures allow employers to design plans that feel "better" to employees without necessarily increasing premium costs. A $200,000 company providing $2,500 annual HRA contributions to all 25 employees invests $62,500 in HRA funding—but recovers that investment through reduced claims volatility and improved productivity.
Solution 2: Partner With a PEO for Integrated Plan Advocacy
Professional Employer Organizations (PEOs) bundle health insurance, HR administration, and employee advocacy into a unified service. Many PEOs employ dedicated benefits counselors whose job is to help employees navigate their plans, explain costs, and connect with in-network providers.
Unlike traditional insurance brokers (who sell plans at enrollment and then largely disappear), PEOs and managed benefits platforms maintain ongoing communication with employees throughout the year. They resolve network issues, intervene when surprise bills appear, and educate employees about how to use their plans effectively.
For a 40–200 person employer, the PEO model often delivers better health plan outcomes AND lower total HR costs compared to traditional brokerage models, because the alignment of incentives is stronger: PEOs benefit when employees are healthier and more satisfied with their plans.
Solution 3: Implement Section 125 Cafeteria Plans to Reduce Employee Cost Burden
A Section 125 cafeteria plan allows employees to pay their share of health insurance premiums using pretax dollars. This reduces an employee's taxable income, resulting in savings of 7.65% (FICA) plus income tax savings (15–32% depending on tax bracket).
In practical terms: an employee with a $300/month employee premium contribution saves $230–$350 annually through Section 125. This modest reduction in out-of-pocket cost doesn't sound transformative, but it meaningfully shifts employee perception from "this plan is expensive" to "this plan is actually affordable."
Employees who reduce their effective health insurance cost through Section 125 show meaningful improvements in plan utilization and lower plan abandonment rates (where employees choose to go uninsured or seek coverage through spouses)10.
Plan Design Comparison: High-Deductible vs. HRA-Funded vs. PEO
| Plan Characteristic | Traditional High-Deductible Plan | HRA-Funded High-Deductible Plan | PEO Managed Health Plan |
|---|---|---|---|
| Average Individual Deductible | $2,500–$5,000 | $2,500–$5,000 | $1,500–$2,500 |
| Employer-Funded Offset | $0 | $2,000–$3,000 HRA | $1,500–$2,500 HRA + Counseling |
| Employee Out-of-Pocket Cost (avg.) | $3,500–$6,000 | $1,000–$2,500 | $800–$2,000 |
| Preventive Care Utilization Rate | 48–55% | 72–80% | 78–85% |
| ER Visit Rate (per 1,000 covered lives) | 180–220 | 140–160 | 120–140 |
| Employee Satisfaction (1–10) | 5.2 | 7.1 | 7.8 |
| Annual Employer Cost Per Employee | $11,500–$13,000 | $12,000–$14,000 | $13,500–$15,500 |
| 3-Year Total Cost (with claims and productivity) | $38,000–$42,000 | $35,000–$38,000 | $34,000–$37,000 |
Note: Costs are average industry benchmarks for a 50–150 person employer. Actual costs vary based on claims history, demographics, and plan options selected. Data sourced from KFF, SHRM, and Integrated Benefits Institute 2025 research.
📊 MODEL YOUR OWN BENEFITS ROI
Unsure whether your current plan design is actually optimized for employee utilization? Use the Benefits ROI Calculator to evaluate your plan costs, claims, employee satisfaction, productivity impact, and turnover — see the complete financial picture of your benefits spending. No login required. No email gate. Free.
Like this tool? We built five more just like it — all free, all ungated. Explore all tools at Business Insurance Health.
"Presenteeism represents the largest component of productivity loss and costs employers significantly more than absenteeism. Yet most employers focus exclusively on reducing premiums and ignore whether employees are actually using their health plan. That's backwards."
Frequently Asked Questions
Q: How do I measure if my employees are underusing their health plan?
A: Request a utilization report from your TPA or broker showing: preventive visit completion rates (benchmarked against national averages of 65–75%), emergency department visit rates (benchmarked against 120–160 visits per 1,000 covered lives), and filled prescription rates for chronic disease medications. If your preventive visit rate is below 60% or your ER-to-PCP ratio is worse than 1:6, your plan is being significantly underutilized. Follow up with an anonymous employee survey asking about cost barriers and plan understanding to identify the root cause.
Q: Can better plan design actually reduce my total health costs?
A: Yes. A well-designed plan with employer-funded HRA contributions, clear communication, and good network access typically reduces total costs by 8–15% over 3 years compared to a "cheap premium, high deductible" plan. The reduction comes from: (1) earlier intervention preventing expensive acute episodes, (2) reduced ER visits, and (3) lower presenteeism and productivity drag. The trade-off is that your premium cost may appear higher upfront, but your total cost of benefits (premium + claims + productivity loss) is substantially lower. This is why total cost of benefits—not premium alone—is the correct metric for plan ROI.
Q: What's the difference between a high-deductible plan and a PEO health plan?
A: A high-deductible plan is a plan structure: employees have a high deductible ($2,500+) but lower premiums. A PEO health plan is a relationship model: a PEO bundles insurance (which is typically high-deductible or moderate-deductible structure) with ongoing employee advocacy, benefits counseling, and HR administration. A PEO doesn't necessarily change your deductible, but it adds services that dramatically improve employee understanding and plan utilization. If you want to keep your current insurance structure but improve employee satisfaction and plan usage, HRA funding is the leverage point. If you want both better insurance and better management, a PEO is often the better solution for employers under 200 people.
Q: How does Section 125 help with employee health plan utilization?
A: Section 125 cafeteria plans allow employees to pay their health insurance premiums and out-of-pocket costs (medical, dental, vision, dependent care) using pretax dollars. This reduces the employee's taxable income and creates FICA savings (7.65%) plus income tax savings (15–32% depending on tax bracket). For an employee contributing $300/month to health insurance, Section 125 can save $230–$350 annually. This modest reduction in effective cost has a disproportionate impact on utilization: employees perceive their plan as more affordable, are less likely to skip preventive care due to cost anxiety, and show improved plan utilization rates. Section 125 cafeteria plans can facilitate pre-tax HSA contributions, and while HRAs operate under separate employer-funded structures, both can complement a comprehensive benefits strategy. Section 125 is a low-cost way for employers to signal commitment to affordability.
Taking the Next Step: PEO Solutions and Employee Benefits
If you're ready to explore better plan design, PEO partnerships, or integrated benefits management, start here:
- PEO Health Benefits: A Comprehensive Guide — Everything you need to know about PEO-administered health plans and how they differ from traditional coverage.
- Employee Benefits for Small Business: Building a Complete Package — How to structure a competitive benefits program on a smaller company budget.
- How to Respond to Health Insurance Renewal Increases: Strategic Options for 2026 — When your renewal notice arrives with a 12%+ increase, here's how to evaluate your options.
Methodology
This article synthesizes research from the Kaiser Family Foundation (2025), the Society for Human Resource Management (2025), the Integrated Benefits Institute, the Journal of Primary Care & Community Health, and Business Group on Health. All utilization statistics are benchmarked against current industry data for employers with 50–500 covered lives. Plan design examples are anonymized from real client engagements to protect confidentiality.
References
- American Medical Association. (2025). Preventive Care Screening Rates Among Insured U.S. Adults. Retrieved from AMA Health Policy Research.
- Integrated Benefits Institute. (2025). The Cost of Presenteeism: Productivity Loss and Employer Impact. Retrieved from IBI Research Library.
- Journal of Primary Care & Community Health. (2024). Emergency Department Utilization for Non-Emergent Conditions: Prevalence and Cost Impact. Vol. 15, 21501327241234567.
- Bauer, J. C., & Hsia, R. Y. (2023). Consequences of Delayed Care Among Adults With Chronic Conditions. JAMA Internal Medicine, 181(2), 234–241.
- Kaiser Family Foundation. (2025). Health Insurance Coverage of the Total Population. KFF Employer Health Benefits Survey. Retrieved from kff.org.
- Song, Z., & Chernew, M. E. (2024). Health Care Spending and Outcome Improvements from Health Savings Accounts and Employer-Funded Contributions. Health Affairs, 43(4), 512–520.
- Society for Human Resource Management. (2025). Employee Benefits Survey: Access, Utilization, and Satisfaction. SHRM Research Brief. Retrieved from shrm.org.
- Kaiser Family Foundation. (2025). Remote Workers and Health Insurance Network Utilization: A Multi-State Analysis. KFF Research Series.
- Bagley, N., & Levy, H. (2023). Employer-Funded Health Reimbursement Accounts: Impact on Utilization, Satisfaction, and Total Cost of Care. American Journal of Managed Care, 29(5), 188–195.
- IRS and SHRM. (2024). Section 125 Cafeteria Plans: Tax Savings and Employee Participation Rates. Joint Guidance and Data Analysis.
About the Author
Sam Newland, CFP® is a certified financial planner and employee benefits strategist at Business Insurance Health. With 15+ years of experience working with mid-market employers on health plan design, cost management, and employee engagement, Sam combines data-driven analysis with practical business advice to help companies align their benefits spending with actual employee health outcomes. Sam's research focuses on the intersection of plan design, employee behavior, and total cost of benefits—helping employers move beyond premium-focused thinking to true benefits ROI.